Supermicro PSU Monitor: Reading Telemetry on Consumer Hardware
Complete monitoring solution for enterprise Supermicro PSUs on consumer motherboards. Read real-time telemetry (Power, RPM, Temperature, Voltage) via Arduino with Prometheus/Grafana dashboards.
Project Gallery
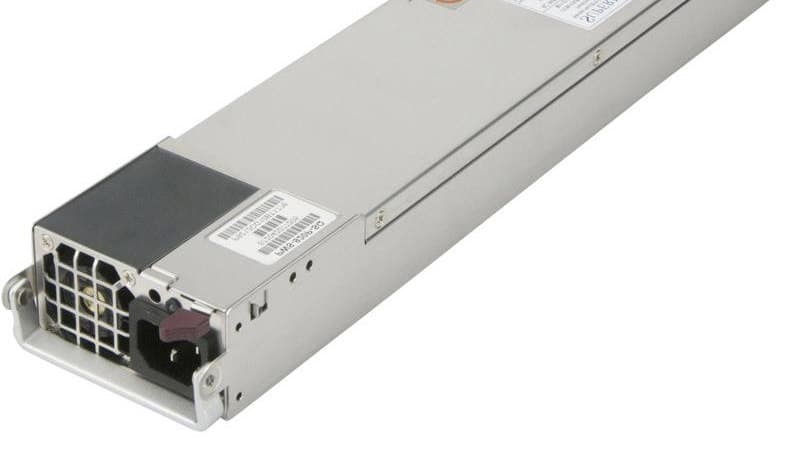
Supermicro PSU Monitor Setup
Project Overview
Supermicro PSU Monitor
Monitor Enterprise Supermicro Power Supplies on Consumer Hardware - No IPMI Required.
This project provides a complete monitoring solution for homelab enthusiasts running consumer motherboards (Asus, MSI, Gigabyte, etc.) inside enterprise Supermicro chassis (CSE-826, CSE-825, CSE-836, etc.).
Normally, these chassis communicate PSU telemetry to the server motherboard via a PMBus/I2C cable. Consumer boards lack this specific header. This project uses an inexpensive microcontroller (Arduino Nano, ESP32, etc.) to bridge that gap, reading real-time stats directly from the Power Distribution Board (PDB). You can preview data in Grafana, or simply in terminal.
🚀 Features
Hardware Monitoring
- Dual PSU Support: Continuous hot-swap monitoring for two PSUs.
- Real-Time Telemetry:
- Thermals: Internal PSU temperature.
- Cooling: RPM readings for Fan 1 and Fan 2.
- Power: Input Voltage, Amperage, Wattage, and Load %.
- Health: DC Good/Fail status.
- Plug & Play: Auto-detection logic instantly reports when a PSU is inserted, removed, or loses power.
Monitoring Stack
- Prometheus Exporter: Python-based exporter that reads JSON data from the microcontroller via serial and exposes Prometheus metrics.
- Docker Compose: Complete monitoring stack with Prometheus, Grafana, and Node Exporter.
- Pre-built Grafana Dashboard: Beautiful dashboard showing power consumption, temperature, voltage, and fan speeds.
- Automatic Staleness Detection: Metrics are automatically removed when a PSU is disconnected.
📋 Compatibility
Chassis & Backplanes
Tested and working with the PDB-PT826-8824 power distribution boards found in Supermicro CSE-826, but will probably work too with CSE-825 and CSE-836.
Power Supply Units (PSU)
Most Supermicro PSUs adhering to the PMBus 1.2 spec should work.
- Tested: PWS-920P-SQ, PWS-1K28P-SQ
- Likely Compatible: PWS-1K21P-1R, PWS-721P-1R, PWS-501P-1R and more
🛠️ Hardware Setup
Required Components
- Microcontroller: Arduino Nano, ESP32, or compatible board
- USB Cable: For connecting microcontroller to your server/monitoring system
- Jumper Wires: 4 wires to connect to the PDB
Wiring
You need to connect to the SMBus/I2C header on the chassis Power Distribution Board (PDB). This is a small, dark, 5-pin header (with only 4 pins populated) located near the PSU slots.
| PDB Wire Color | Signal | Arduino Nano Pin | Function |
|---|---|---|---|
| Yellow | SDA | A4 | I2C Data Line |
| Green | SCL | A5 | I2C Clock Line |
| Red | VCC | VIN | 5V Power Source |
| Black | GND | GND | Ground |
💻 Microcontroller Setup
1. Install PlatformIO
Follow the PlatformIO installation guide for your platform.
2. Configure Output Mode
The microcontroller supports two output modes in src/main.cpp:
// Human readable, or JSON for Prometheus
bool jsonOutputMode = true;  // Set to false for human-readable output
- JSON Mode (recommended): Outputs structured JSON for the Prometheus exporter
- Human-Readable Mode: Formated output for lightweight monitoring
3. Build and Upload
cd /path/to/Supermicro-PSU-monitor
pio run --target upload
pio device monitor
If you just want to monitor in terminal, that's all!
🐳 Monitoring Stack Setup
The complete monitoring stack runs in Docker and includes:
- Prometheus: Time-series database for metrics
- Grafana: Visualization and dashboards
- PSU Exporter: Custom exporter for PSU telemetry
Prerequisites
- Docker and Docker Compose installed
- Microcontroller connected via USB (typically
/dev/ttyUSB0) - Microcontroller flashed with firmware in JSON mode
Quick Start
- Clone the repository:
git clone https://github.com/NasiadkaMaciej/Supermicro-PSU-monitor.git
cd Supermicro-PSU-monitor
- Verify serial device:
ls -l /dev/ttyUSB*
# Should show /dev/ttyUSB0 or similar
- Start the monitoring stack:
docker-compose up -d --build
- Access the services:
- Grafana: http://localhost:3090 (default credentials: admin/admin)
- Prometheus: http://localhost:9090
- PSU Exporter: http://localhost:8000/metrics
Grafana Dashboard Setup
-
Log in to Grafana at http://localhost:3090
-
Add Prometheus as a data source:
- Go to Configuration → Data Sources
- Click "Add data source"
- Select "Prometheus"
- Set URL to
http://prometheus:9090 - Click "Save & Test"
-
Import the PSU dashboard:
- Go to Dashboards → Import
- Upload
grafana/dashboards/psu-dashboard.json - Select the Prometheus data source
- Click "Import"
Note: The Grafana dashboard automatically adjusts to show only connected PSUs. When a PSU is disconnected, it disappears from charts. The dashboard works seamlessly with both single and dual PSU configurations.
📊 Sample Output
JSON Mode (for Prometheus)
The microcontroller outputs one JSON object per PSU every 2 seconds:
{"id":1,"temp":54,"fan1":1488,"fan2":1488,"v_in":242.0,"i_in":0.31,"p_in":71,"ok":1}
{"id":2,"temp":53,"fan1":1603,"fan2":1488,"v_in":241.0,"i_in":0.31,"p_in":74,"ok":1}
Human-Readable
Set jsonOutputMode = false in src/main.cpp for formatted output:
Scenario: PSU #1 is not plugged in, then is connected, and power cable is attached
Supermicro PSU monitor
[2s] PSU #1: --- OFFLINE ---
[2s] PSU #2: 54C | 1488/1488 rpm | DC OK | 242V / 0.31A / 71W
[4s] PSU #1: --- OFFLINE ---
[4s] PSU #2: 54C | 1488/1374 rpm | DC OK | 242V / 0.31A / 71W
[6s] PSU #1: --- OFFLINE ---
[6s] PSU #2: 54C | 1488/1488 rpm | DC OK | 241V / 0.31A / 71W
[8s] PSU #1: --- OFFLINE ---
[8s] PSU #2: 54C | 1488/1488 rpm | DC OK | 241V / 0.31A / 70W
[10s] PSU #1: 20C | 0/0 rpm | FAULT | 0V / 0.00A / 0W
[10s] PSU #2: 53C | 1488/1488 rpm | DC OK | 241V / 0.31A / 71W
[12s] PSU #1: 20C | 0/0 rpm | FAULT | 0V / 0.00A / 0W
[12s] PSU #2: 54C | 1488/1488 rpm | DC OK | 241V / 0.31A / 74W
[14s] PSU #1: 21C | 229/229 rpm | FAULT | 255V / 0.00A / 3W
[14s] PSU #2: 53C | 1603/1603 rpm | DC OK | 241V / 0.31A / 74W
[16s] PSU #1: 21C | 1374/1030 rpm | DC OK | 243V / 0.00A / 46W
[16s] PSU #2: 53C | 1603/1603 rpm | DC OK | 250V / 0.31A / 74W
[18s] PSU #1: 21C | 1374/1030 rpm | DC OK | 244V / 0.37A / 46W
[18s] PSU #2: 53C | 1603/1488 rpm | DC OK | 244V / 0.12A / 18W
🧠 Technical Reference: Register Map
The code implements a lightweight subset of the Supermicro PMBus specification. Below is the reference map for the vendor-specific area should you wish to extend functionality:
| Register | Description | Formula / Notes |
|---|---|---|
| 0x09 | Temperature | Direct value in °C |
| 0x0A | Fan 1 Speed | RPM = (1/0.262) * (Raw * 30) |
| 0x0B | Fan 2 Speed | RPM = (1/0.262) * (Raw * 30) |
| 0x0C | Power Status | 0x01 = DC Good, 0x00 = Failed |
| 0x14 | AC Current | Value / 16.0 = Amps (RMS) |
| 0xF4 | Input Voltage | Direct value in Volts (AC) |
| 0xF5 | Input Power (L) | Low Byte of 16-bit Wattage |
| 0xF6 | Input Power (H) | High Byte of 16-bit Wattage |
Unused Registers for Potential Extension:
- 0x0D: Temp Limit (Temperature High Limit (°C))
- 0x0E: Fan 1 Min (Minimum Fan Speed Limit (Raw))
- 0x0F: Fan 2 Min (Minimum Fan Speed Limit Raw)
- 0x16: FW Version (Firmware Version (e.g.,
0x21= Rev 2.1)) - 0xF0: AC Limit (Max AC Current (
Value / 16.0= Max Amp)) - 0xF1: DC Limit (Max DC Current (
Value / 2.0= Max DC Amps)) - 0xF2: Rated Wattage (Low Byte of 16-bit word)
- 0xF3: Rated Wattage (High Byte of 16-bit word)
- 0xF5: Input Power (Low Byte of 16-bit Word (Watts))
- 0xF6: Input Power (High Byte of 16-bit Word (Watts))
- 0xFF: Write Protect (Write Protection Status)
🤝 Contributing
Contributions are welcome! Please feel free to submit issues or pull requests.
⚖️ License
MIT License. See LICENSE file for details.
Related Projects

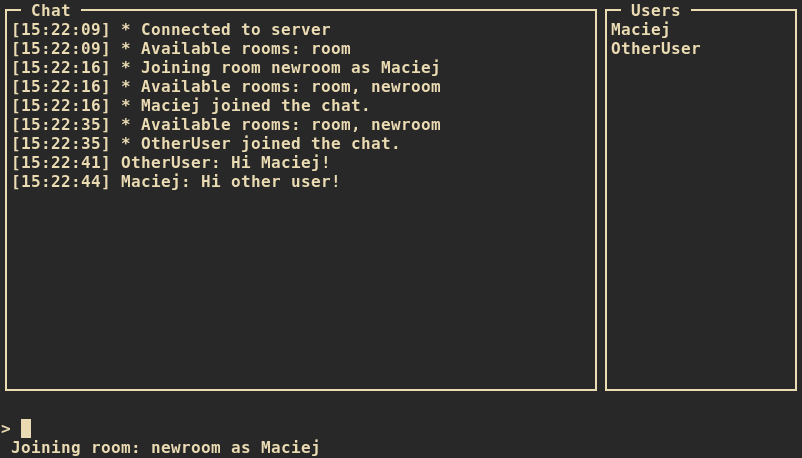
Chat Client
A terminal-based chat client written in C++ using ncurses and WebSockets. Lightweight, fast, and compatible with the JS ChatApp server.